This post explores asking prices of real estate in Tampere between October 2017 and January 2022. I will look on how it changed in time, and will examine different categories, like new property, resold property, apartments, row houses and family houses, and I will summarize it on map, like this:
If you aren’t interested in anything besides the price map, you can see it here.
Data
I work with a dataset consisting of real estate ads that was scraped from Google Search cache.
To study the change of the prices in time, I create a data structure with items for every day from the 4 years, where there are all the rental ads that were up some time during that day. So that if ad_1 was published only on 2018-01-04; ad_2, ad_3 and ad_4 were published on 2018-01-04 and 2018-01-05; and ad_5 only on 2018-01-05, the data structure will look as:
| Date | published ads |
|---|---|
| 2018-01-04 | ad_1, ad_2, ad_3, ad_4 |
| 2018-01-05 | ad_2, ad_3, ad_4, ad_5 |
| … | … |
We see that a data item can be included in more than one date. In fact, it’s included in the field for every day when it was published. I study the price day by day for the entire 4 years.
One of the most important things I realized while working on this, is that pricing of new and resold real estate is very different and worth to study separately.
Number of new and resold property ads
Here we can see the volume of real estate selling ads for Tampere per day. New real estate is plotted in blue and resold in green. There is some data missing from October 2019 to Feburary 2020, my tooling went off unnoticed.
There was a lot of new housing coming to market in 2018 and 2019. In both categories, there is less and less real estate for sale since mid-2019.
Selling price growth
Let’s first take all of the days, count median m²-price, and then plot it. New real estate is plotted in blue and resold in green.
Between 2018 and 2022, median price of new real estate grew my 24% (~4600 to ~5700 per m2) and median price of resold real estate grew by 48% (~2500 to ~3700 per m2). As there was a lot of new housing coming to market in the last 4 years, it also got resold (within the measured time period), and that might explain so big price growth for the resold property.
Price development of apartments vs row vs family houses (resold property)
Here I populate each day with the listed ads, and further split them to 3 categories by type:
- Kerrostalo and Luhtitalo
- Rivitalo and Paritalo
- Omakotitalo
I only explore the categories in the resold property. The new items seem to be statistically different and don’t capture behavior of individuals.
I merge the row and pair houses because I think they are very similar in characteristics and not worth to look at separately. Same for apartments in blocks and in loft houses.
We can see that the apartment prices rose fastest. Family and row houses stayed pretty much the same until December 2020 when the price of family houses in Tampere started to rise. In the end of 2021, also the price of row houses jumped up.
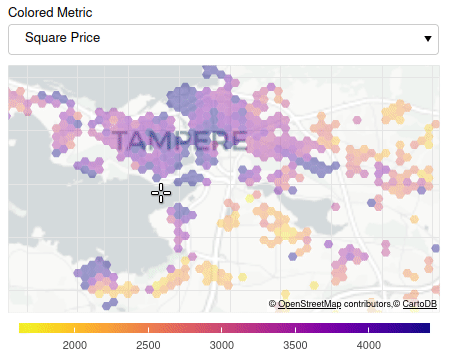
Price map of Tampere
To present asking the data by location, I created following visualization. Area of Tampere is arbitrarily split to hexagonal cells. Ads are grouped by cell, and several statistics are computed per cell
- median price of ads in the cell, in €/m²
- number of ads in the cell
- average of year built in the cell
- slope and intercept of least-squares regression line of propery area vs property price
The cells are then colored based on selected metric.
Double-click on a cell will open a detailed view which lists ads posted in the last 4 years. It also show a scatter plot of property are vs property price, and the regression line. Point on the scatter plot are colored based on how recently the ad was posted.
The map is here.