In this post, I will explore and show how various features of an apartment (age, location, year built) affect rental price in the city of Tampere. I hope it will be interesting for someone who’s renting (or letting), to understand the situation better. I will not explore price development over time in this post, but I will write another one on the topic.
Data
I work with a dataset of rental ads that I scraped from Google search cache in 2018, 2019 and 2020. It’s by far not complete, but it’s representative enough.
Outlier Removal
It’s good to remove data that will not contribute to examined statistics. For this post I only consider apartments in block and loft houses (“kerrostalo” and “luhtitalo”), I don’t look at row and pair houses. I also removed short term “business” (forenom) apartments, single rooms, and obvious typos.
Deduplication
Within the 3 years of the data gathering, some apartments show up more than once. It happens when an advertised apartment is let, then the tenant leaves, and the owner advertises the apartment again. For the analysis in this post, the duplicates are unwanted - if we count an average price of apartments in an area, we don’t want a signle apartment to be counted more than once. It’s different than tracking price development over time.
I deduplicate by grouping by street address, apartment area and floor number. If there are two (or more) ads on the same street address of the same size on the same floor, I only pick the latest one. There is about 40000 ads that passed the previous cleaning, and after deduplication only 24000 was left.
Area of Interest
I start with rental apartments in 15 km circle from the center. That includes also Ylöjärvi, Nokia, Pirkkala, Hervanta, and probably couple of more small places. You can see the circle on following image. The colorful mess are rasterized datapoints, colored based on m²-price, I will explain it later. There’s about 24000 datapoints.
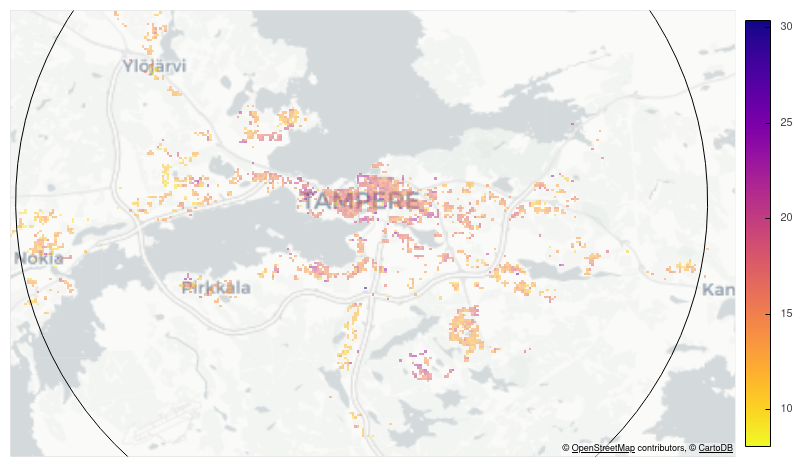
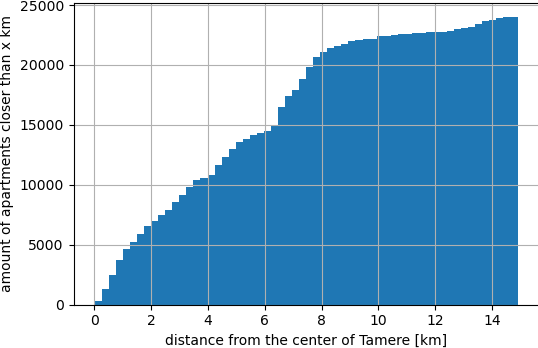
We see that the amount of rental apartments decreases with the distance from the center. Let’s see the density and cumulative histograms of distance to the center of Tampere, to get the idea of how much rental property is there over a distance from the center.
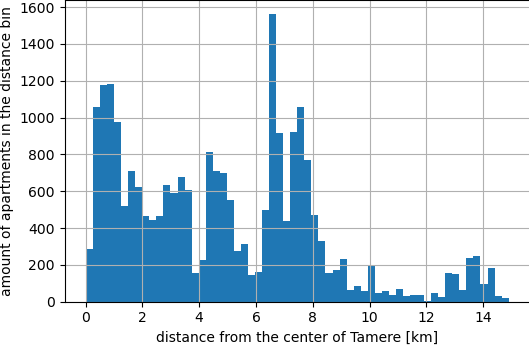
The left (upper) histogram shows that there’s a lot of rentals within 2 km from the center, then not so much (when the circle expands over the lakes), and then after 4 km the circle captures the coast of Härmälä on the south, and Niemi in the northwest. One of the peaks between 6 and 8 km is Hervanta. The small bump around 13 km is Nokia.
The right histogram shows that, from the 24k ads, one half (12k) is within 4.5 km from the city center. Only 3000 ads are further than 8 km. This indicates that the 15 km radius is too much, and perhaps the 8 would suffice.
Factors of Aparment Rental Price
The metric - €/m²/month
How to compare rental price of many apartments given that apartments come in diferrent sizes? An obvious measure is price per m². If a 50 m² apartment is 750 €/month, its price per m² is 15. As it’s a rental price, It’s 15 €/m²/month. Let’s see the histogram of price per m² for all the apartments within 15 km from the center of Tampere. I plot 2 categories - apartments within 4 km from the center, and apartments further than 4 km (until 15 km).
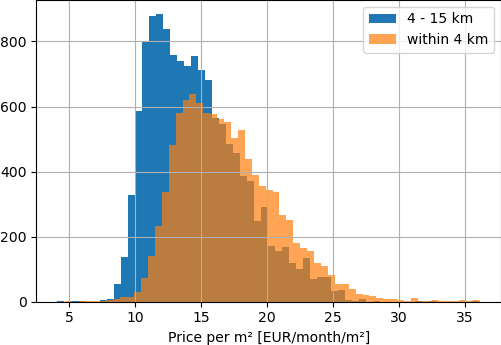
From the histograms we can see that
- apartments under 12 €/m²/month are mostly further away than 4 km
- median m²-price for apartments closer than 4 km is ~14 €, that’s 700 €/month for 50 m² apartment
- median m²-price for apartments further than 4 km is ~12 €, that’s 600 €/month for 50 m² apartment
- there is a peak around 14 € in the blue histogram, indicating that portion of the 4-15km data is more similar to the <4km category
Apartment Location
It would be good to see how expensive are areas of Tampere on the map. It’s not reasonable to plot all the rental ads, there’s too many of them, and they are not well distributed. Rather, I split the area to a grid and aggregate datapoints in a square cell (about 100x100 meters). The cell is then displayed on the map and colored by the mean m² price of all the datapoints within. The yellow squares are 10 €/m²/month (500 € for 50 m² apartment), and the blue ones are 30 €/m²/month (1500 €/month for 50 m² apartment). The color bar is on the right. You can use mouse wheel for map zoom.
If you hover your mouse cursor over a color, the tooltip will show
- the m² price of the cell
- price for 50 m² apartment with such m² price
- how many datapoints are in the cell
- average construction year in the cell
Distance from the Center
Let’s see how distance from the center affects rental m² price. I show it in a rich boxplot.
Obviously, centrally located apartments are more expensive, but the correlation is a bit chaotic.
Neighborhood
Location as a factor of rental price can also be shown based on municipal areas. I picked areas of postal codes, because the boundaries can be downloaded from Statistics Finland. I managed to get a geojson with polygons of postal areas, where there are also
- demographic data (number of inhabitants, males/females, age groups)
- household and individual income data
- number of rental-occupied and owner-occupied households
In following choropleth, I show postal areas and for each of them
- the average m²-price
- price of 50 m² apartment based on the average
- number of rental ads in the area
- number of inhabitants
- how many more percent of women than men live the area
- number of rental-occupied vs owner-occupied households
- median household income
By default, the area will be colored based on the mean m²-price, but you can select other metric for the color. You can also zoom with mouse scroll.
The polygons and data about income, household and demography are from dataset Postal code area boundaries, downloaded from Statistics Finland’s interface service on 1 January 2021 with the licence CC BY 4.0.
Year Built
Intuituvely, older apartments are cheaper and newer apartments are more expensive. In following rich boxplot, I show what’s the median price, and what is the most common price range, for aparments built in particular year.
Here we observe that
- average rental price of 50 m² apartment built before 1963 is ~800 €/month
- average rental price of 50 m² apartment built 1963-1983 is ~600 €/month
- not so many apartments were built in 80s and 90s (note the histogram above the box plot)
- there was a huge development boom after 2015
- apartment rental price grows quite steeply and linearly for the last decade (2010-2020)
I was most surprised by the drop of the price for apartments from the 70s and by the steepness of the price raise in the last decade.
Considering a 50 m² apartment, each year of age between 2009 and 2021 will raise the monthly rental price by 47.5 € - for items built in 2009 it’s 676 € and for items (planned to be) built in 2021 it’s 1000 €.
Conclusion
I don’t really have any conclusion here, I leave it up to the reader. There are factors that I omitted, for example effect of apartment size on it’s m² price. It would be higher for smaller apartment and lower for large ones, and I don’t see it as an interesting statistic.
Other factors which would be worth researching are
- sauna in the apartment - is apartment with sauna worth more in rent? This could be interesting for developers, who consider expenses for apartment block construction.
- floor location - are apartments on top floors more expensive and how much?
- heating type - how electric heating, central heating, water floor heating project to rental price
- time of the year of rental ad publishing - when’s the best time to let/rent an apartment